Intersectionality is a term that we only briefly touched on in our report on how grantmakers are collecting and using demographic data.
“Within certain categorical constituencies, like veterans, homeless, immigrants, uninsured, etc., there is a great deal of meaningful variation and change. Decades of social science research speaks to how issues of gender, race, age, and socioeconomic status might have an impact on how individuals experience these larger circumstances and how they engage interventions to address them.”
Intersectionality is defined as: an approach largely advanced by women of color, arguing that classifications such as gender, race, class, and others cannot be examined in isolation from one another; they interact and intersect in individuals’ lives, in society, in social systems, and are mutually constitutive.
This means if philanthropy is serious about its mission, it has to get serious about intersectionality. We need data to unpack the layers of oppression and systemic inequities that keep us from making substantial progress. Yet, our data collection efforts haven’t even begun to contemplate this complex issue.
Bias is coded in the system.
We are finding out more about how racial bias is being coded into our technology and AI, like the example of the racist sensors in bathrooms. For years, it was a joke in black communities. Then, a video went viral that demonstrated the problem in perfect detail: Those sensors were designed to reflect off white skin. Not black skin.
We are also coming to understand that this same racial bias has been coded into the interventions and programs that nonprofits design and philanthropy funds. Our bias is coded into the system because it’s coded into who is at the table (decision-makers).
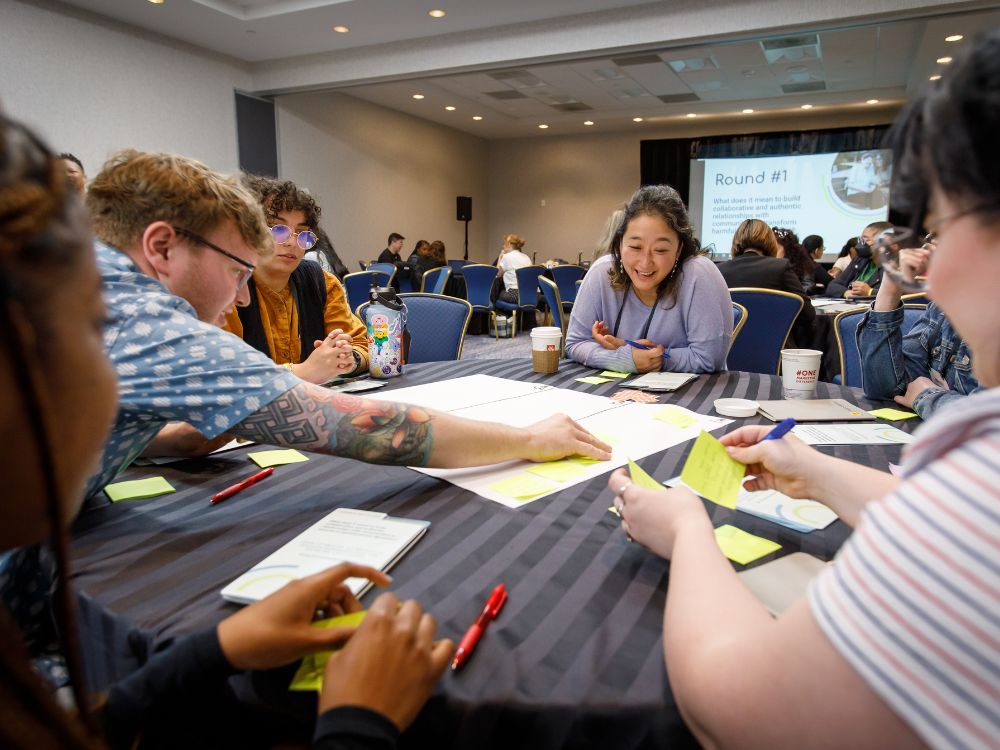
Recently, a friend told me a story of serving on a local theater board in Ruraltown, USA. She was the youngest person on the board and the only female, and the all-white board was having a discussion on how to attract a more diverse audience for their performances. As they discussed promotional ideas, she got frustrated. No ad in the local paper, radio spot, or flyer by that one black-owned store in town was going to cut it. This wasn’t a promotional problem, it was a leadership problem.
This led me to ask her, “How will they know when they have a diverse audience?” First, what do they define as diverse and who exactly are they trying to reach? And second, while they said they could make a good guess by simply looking at their current audiences, what would they really know about the people who frequent their performances? All of the pieces of our identity – race, ethnicity, gender, sexual orientation, language, culture, religion, ability, age, color, income, geography – intersect to create the person we are, and most of these are not visible. Reducing that to “looks white” or “in a wheelchair” reduces us all to the basest generalizations.
But, how does a small rural theater begin the process of collecting disaggregated demographic data about its constituents? It’s hard, it costs money, and they don’t have the internal expertise or capacity to even being to consider adding this to the to-do list. And, there the conversation ends.
This same story is being echoed across the nonprofit sector, as nonprofits confront the challenges that arise when they try to collect demographic data on who they are serving. So, they look at some Census numbers and eye up their constituents and make an educated guess.
Then nothing changes. (Rhetorical question: I wonder whether anyone’s bothered to fix the racist bathroom sensors?)
If we don’t know, you can’t blame us.
Collecting disaggregated data is a big challenge, especially for small nonprofits. But, it’s also a big challenge for philanthropy. At a recent community meeting, our local community foundation was releasing the initial findings from its human needs assessment. My question – “What does this data tell us about whether certain populations are more or less impacted by these needs?” The answer was – it doesn’t. They focused on issues like needs for youth or the elderly in our community, but they could not tell us how this data differed for different populations. The resources needed to collect this data through a randomized research survey was beyond the capacity of our local foundation.
Just like the nonprofit, individual funders will encounter the same problem of incomplete and pieced together data on which to base their strategy and decision-making.
In PEAK Grantmaking’s survey of grantmakers, we found that much of the data that was being collected was categorized according to programs’ intended impact, for example, veterans, homeless, youth, elderly, etc. However, we know that demographics within these categories (like male vs. female veterans or Black vs. Latinx homeless youth) were often not included. But while some funders claimed “they know who they are serving so they don’t need to collect the data” or that “It’s irrelevant to our mission,” many recognized the value of having this data and being able to better target their funding efforts. Even with this recognition came the assertion of many challenges stood in their way.
It comes down to impact.
This demographic data has important implications for the impact a program can have, and different interventions will have varied impact. As illustrated in the theater example above, it may not be a marketing problem when a nonprofit program designed by white people for people like them does not attract or help people who are not like them. We know this, but we’re not sure how to move forward from where we are.
And, when a local foundation confronts the issue of the cost of randomized and scientific data collection, they also may not have the capacity – or the will – to divert time and resources from mission fulfillment into rigorous data collection.
There are important variations within target populations that have an impact on the intervention or program design, but this variation is often obscured by collecting only categorical data like veteran, or disabled, or black. Without considering the intersections between these categories, we are missing the mark on program design. If we go back to our soap dispenser example, if our soap dispensers will only dispense soap for white people, everyone else leaves without clean hands and public health outcomes are lessened. Not only that, everyone else leaves feeling frustrated because they got shorted.
What is the solution?
There are no easy solutions, but it is something we have to tackle together as a sector, in partnership with our local, state, and federal governments.
There is no mystery as to how to get started:
- Cede more decision-making power to people who are not cis, white, able-bodied men. When our CEOs, strategy teams, board rooms, program officers, and program managers are diverse, better solutions – and better decisions – will emerge.
- Fund grassroots community organizations and leaders to build and define their own solutions rather than guessing what might work best for them.
- Identify some first steps to take on collecting disaggregated data. Without knowing the real extent of who is being excluded, we don’t know what impact we are failing to have. We can make real progress, but only if we don’t let challenges to data collection stand in our way.
Dive into this topic on our upcoming webinar, Digging into Demographic Data, October 16.